It’s towards year end, and it’s about time to revisit the portfolios of mine. In the previous post, I talked about starting my supplementary portfolio afresh by unloading all the funds, except the mineral funds which has currently giving a negative returns of more than 10%.
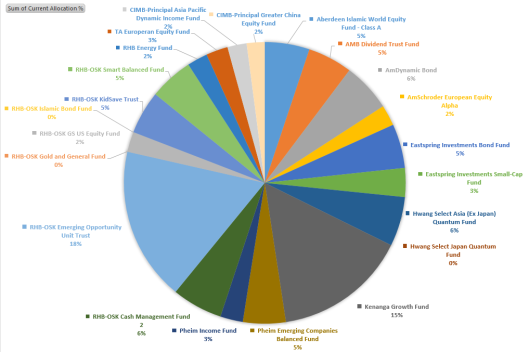
In my core portfolio, I have a total of 14 funds. My task this month and next would be re-position them in my portfolio. The outcome of the exercise could be either consolidation or further diversification of these funds.
Before I start that, I would like to go through the performance of each of these funds.
| Fund Name |
ROI |
| Kenanga Growth Fund |
32.99% |
| RHB Emerging Opportunity Unit Trust |
4.69% |
| Eastpring Investments Bond Fund |
9.71% |
| AmDynamic Bond |
16.49% |
| Affin Hwang Select Asia ex Japan Quantum Fund |
36.16% |
| Aberdeen Islamic World Equity Fund |
18.98% |
| Amanah Mutual Berhad Dividend Trust Fund |
13.48% |
| Pheim Master Trust – Emerging Companies Balanced Fund |
4.13% |
| RHB KidSave Trust |
(3.95%) |
| RHB Smart Balanced Fund |
24.87% |
| Eastpring Investments Small Cap Fund |
107.73% |
| Pheim Master Trust – Income Fund |
8.69% |
| CIMB-Principal Asia Pacific Dynamic Income Fund |
7.15% |
| AmAsia Pacific REITs Fund |
2.62% |
From the 14 funds, 13 of them has given positive return except the 1 RHB KidSave Trust, which is giving -3.95% ROI.
I’m using Morningstar MY to help me to plot out the geographical focus as well as other information of the funds within the portfolio to understand the true exposure / diversification of the portfolio. It has a feature called X-Ray, which will consolidate all the information about the portfolio that you setup within the website, and display them into a dashboard like interface. giving you an overview of the portfolio. You can even opt to generate the report into PDF format.
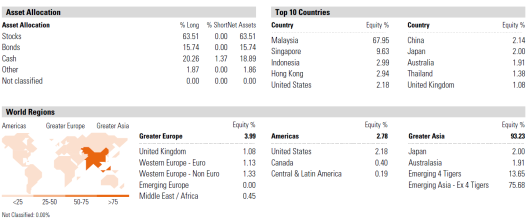
Asset Allocation and the Geographical Diversification
The image above shows the asset allocation of the portfolio, and currently it’s rather balanced, with only 63.5% invested in equities and others are either bonds, or cash and even real estate (Other category in the chart). Going forward, this shall be the case, as I’m not overly positive of the equities trend in near future, thus I will remain this allocation.
In terms countries/geographical allocation, I’m investing heavily in Malaysia with close to 68% exposure. In the recent year, Malaysia’s KLCI hasn’t been performing well, in fact YTD it’s returning -1.98%. From the standpoint of World Regional diversification, the portfolio is heavily invested in Greater Asia, with 93% allocation. A major portion of this is focusing in Emerging markets and YTD it’s returning 11.89%. I believe this has been contributing much to my overall performance in recent years.
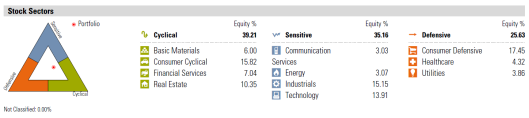
Stock Sectors Distribution
The X-Ray report is showing the stock sectors distribution as well, a rather useful information to give me the understanding how the portfolio will be affected by the various major trend in the world. There’s 39% of underlying stocks classified as cyclical, which will be highly affected to the major market trend, and typically stocks under such category will have a wider swing in trends. Following behind the cyclical is sensitive stocks, which comprised of 35% of the underlying allocation and only 25% of the underlying stocks are defensive. I would based on such information to shift my allocation following the major trend. My current take is defensive stocks (more to come in follow-up posts), the market has had it bull run for years, and any major switch of trend will create too much volatility to the overall portfolio.
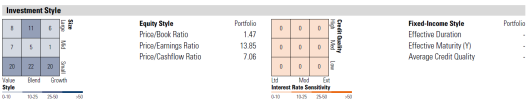
Underlying Investment Style Distribution
The last portion of the report that I would highlight here is the investment style distribution. From the image, I’m heavily focused on small cap stocks. Depending on your risk appetite and your preference, you can use the diagram as your basis to make any adjustments. In my case, this could be focusing more on large caps with defensive nature, as I’m seeing more downside in near future.